When you know about the normal state of your network and servers, then you can easily spot the abnormal by just monitoring its logon activity. So, In this tutorial we will guide you on the complete setup of a tool that will analyze your logs and reports back about every activity on your servers.
Logwatch is an Open Source Logs management and monitoring tool that monitors each and every activity on the server and sends an email about the summary of logs to the administrator in the form of daily or weekly reports on daily basis or according to its configured settings. It summarizes the logs from multiple machines in a single report, which can streamline network maintenance and speedup incident response.
Base Environment
We are about to setup Logwatch on a Ubuntu 14.04, there is no minimum requirements about the resources but you must have root level privileges on the server where you are going to install it. You are connected to the internet and have assigned a static IP to your machine with fully qualified domain name.
More over your system should be properly up to date and patched with required dependencies. So, before getting started with the installation run the following commands to update your system to update its packages list..
root@ubuntu-14:~# apt-get update
Installing Logwatch
Logwatch installation package can be installed through its available packages in all Linux distributions so its not a big problem to get it installed on your linux server. It’s safe to install Logwatch without any ambiguity as it doesn’t run as a daemon, so it doesn’t interact with any other running services. To install Logwatch on Ubuntu 14.04 run the following command with root user.
root@ubuntu-14:~# apt-get -y install logwatch
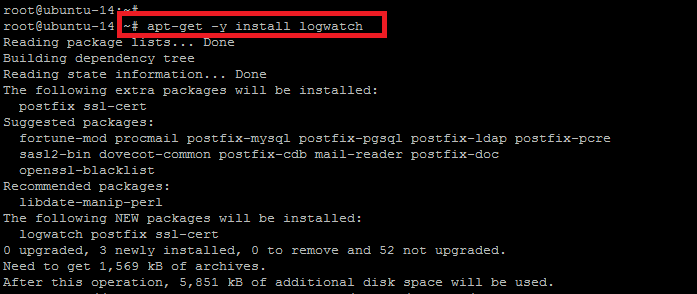
During the installation process you will be prompted to configure few installation packages, so choose the best settings as per your requirements.
Postfix Configuration
Here you need to choose the mail servers configuration according to your environment. Let’s choose from the provided general types of mail configuration and press ok to proceed.
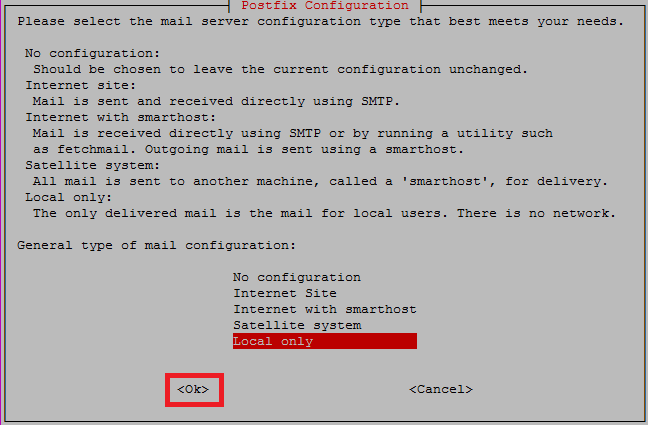
Let’s configure your system mail name that should be fully qualified domain name. Most probably the mail name is the hostname of your server. Read the instruction carefully during the configurations to choose the best options according to your requirements.

Once the logwatch installation is done, you will be able to see the end results of installation as shown in the snapshot.

Logwatch Configurations
Now let’s move forward with configuration of Logwatch, make sure that your server’s emails are functioning properly and are able to send email via postfix.
L ocations of Configuration File
There are two configuration file options, one for its local configurations and the second for its default configurations. The local configurations file is located in /etc/logwatch/conf/logwatch.conf while the default configurations file can be configured in /usr/share/logwatch/default.conf/logwatch.conf.
Common Configurations
To make changes in the default configuration file of Logwatch, open the file with your file editor and configure it for setting up the common configurations.
root@ubuntu-14:~# vim /usr/share/logwatch/default.conf/logwatch.conf
This is the default configuration file of Logwatch and we will just change its email settings here as required.
- The Recipient email address to which daily email reports will be sent can be changed here as:
#MailTo = root
MailTo = user@vexxhost.com
- The Sender email address from which the reports will be received can be changed as:
MailFrom = Logwatch
MailFrom = user@vexxhost.com
- The Default Time Range for reports can be changed here to All, Yesterday or Today.
Range = today
- The default detail level for the report can also be changed from the available options here. The available options can either be Low, Med, High or a number.
Detail = Low
- The default service(s) to report on can change here if required.
Service = All
This can be left as All to receive reports from all services and applications running on the server. If you don’t wish to get reports from all services then you can change this option from All to any specific service name, for more than one service to be reported on just update the file with multiple options like:
Service = apache2
Service = ssh
Service = mariadb
After making configuration changes as per your requirements save the file with wq! if you are using vim editor and then check if your logwatch is working fine.
Testing Logwatch
In order to test the logwatch we can manually run the logwatch service whenever we need to get the report. To test the Logwatch simply run the logwatch command as:
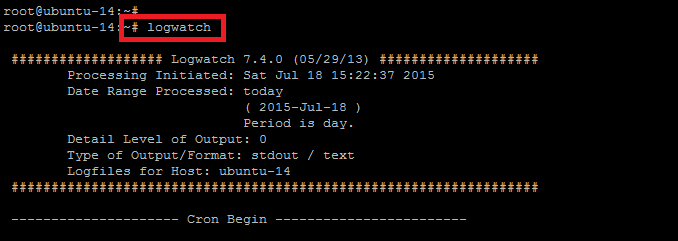
root@ubuntu-14:~# logwatch
The starting report format from the logwatch will like as below.
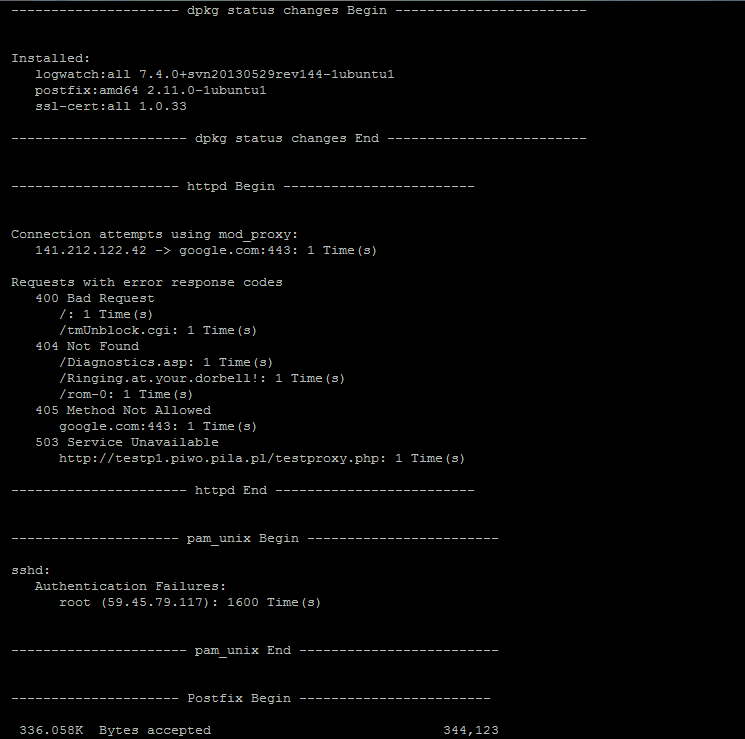
The logwatch command will shows the report from from each service running and applications installed on it. Following is the result of logwatch from some of the service running on it like postfix, ssh, etc.
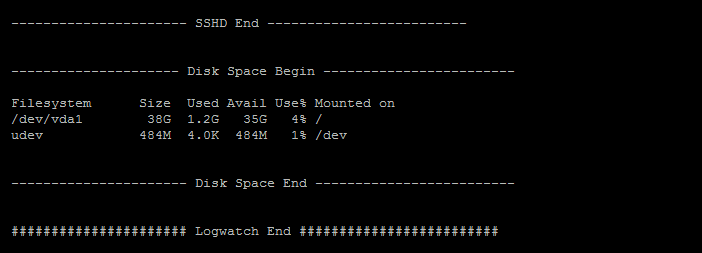
The logwatch command will end with following lines by showing the report about the filesystem disk space usage.
Conclusion
Logwatch is one of the best tool that every system administrator must give it a try and use this to monitor the logs of a server running some critical services on it where multiple number of users connects on daily basis and you have to look after the logs if anyone had made any changes on the server. So, get ready with your Logwatch setup and start analyzing your logs with an efficient and professional way. Feel free to comment us here if need further assistance or if you face any kind of problem during its setup.